Tips: Simple steps to reduce your internet energy consumption (and Co2 emission)

As highlighted in my previous blog post, Internet and Data Centers are huge energy consumers and therefore a significant source of CO2 emissions, up to 1 or 2 % of global emissions, almost as much as the Airlines industry.

As promised at the end of that earlier post, and as your use of electronic cloud storage, internet surfing, email communication, social networks, audio and video conferencing, music or video streaming (etc.)  consumes a lot of energy, let me give you a few tips and steps you can take to reduce your personal internet carbon footprint:

Cloud storage:

as you are dumping your photos, videos, music and back-up data into the Cloud, whatever Google Drive, Microsoft OneDrive, Apple iCloud, iDrive, pCloud, Amazon Cloud, DropBox or other provider, look at how many GigaBites you store there – 10 GB, 100GB, 500GB, 1TB ? – All that storage occurs on servers somewhere, and those servers need energy to run. Data centers that house all this storage run 24/7, with redundancy back-up, require massive amounts of energy to process your data and to cool the servers. So, the first easy step is just to go over your photos, videos, music, documents, sort it and do a spring cleaning, getting ready of what is useless, too old or redundant, that you’ve been clutting over the years and will never use. It is not fun, it takes time, but it is efficient. To lead by example, I did some yesterday and saved 20GB of Cloud Storage (and of my laptop storage capacity which is almost full at 500GB). Another Tip: If your computer, tablet or phone, backs up photos and videos automatically to Google Photos: To make sure to reduce space, by resizing them, Go to Preferences menu, look under Photo and video upload size and select High Quality (free unlimited storage). Google will shrink photos to 16 megapixels and videos to a resolution of 1080p. Although this may reduce image quality a bit, most photos and videos will still look great. Apple and iPhone users can do the same on Apple iCloud. And last but not least, decide which files you really want to keep and upload in your cloud.  Stop automatically syncing everything. Keep a folder for important backups, and only sync that to your cloud storage. Just a heads-up, there is a big chance that you may be duplicating some cloud storage of the same files in several providers, ie on Google Drive and Apple iCloud.

Email:

Your Email box is yet another dirty and full closet, with thousands of files clutter up servers, some of them 10 or 20 years old, archived or not, with or without attachments, attachments that you probably already saved anyway if they had any value at that time, they still suck-up energy unnecessarily. Again there is an easy fix, whatever you use Outlook, CleanEmail, Gmail, Hotmail, Apple Mail, or other, just go back in time and get rid of old emails which have no value today, specially sort by size of emails and attachments so you can prioritize and get rid of the bigger ones, and save space. I do it regularly, still my Outlook file is 17GB, including archives. Also delete all spam, advertising emails daily, junk, unsubscribe from useless newsletter, promotions and notifications you received daily, weekly or monthly and you never open. Finally use the function to only download images from the emails received and open images only when you decide too, this will reduce your internet and network consumption. And keep in mind that all in all sending a single email results in about a gram of CO2 being released into the atmosphere.

Social Media:

If you’re a social media addict as I am, you probably have accounts Facebook, Instagram, Twitter, Pinterest, Snapchat, LinkedIn, What’s App, YouTube, TikTok (I have all of them)… so now is the time to purge your social media: just go to settings of the apps, and download an archive of your data before you delete it online. It is good practice anyway to clean-up your digital history, as it’s stay there forever, like it or not, until you delete it (sometime you can’t even do that). I will not go into the details of each platform, but as an example on Tweeter, you can download your archive by opening Twitter Settings on the web and choosing Your account and Download an archive of your data. You can also use tools such as Tweet Delete or Tweet Deleter. For Facebook and Instagram there are  limited options for deleting older posts, but you can still delete old posts manually one by one though, and you can also make use of the Stories feature on where posts automatically disappear after 24 hours anyway.

Online Activity:

whatever browser you use, Google Chrome, Internet Explorer Edge, Firefox or Safari, there is way to reduce your consumption by using some of the tools, settings and auto-deletion of your browser. As an example, log into your Google account, click “Data & personalization” about your online activity, your search history, and your location—both to personalize your experience of its apps and to serve up targeted ads. In all of these categories, you can select the Auto-delete option to have the data erased.

Streaming:

Audio and video streaming is one of the worst when it comes to power use and carbon emission: Just In the US, streaming music dumps between 25,000 to 40,000 tons of carbon dioxide into the atmosphere annually. Now with people moving more and more to IPTV, Netflix, Amazon, Disney, Hulu, Roku, AppleTV and others, streaming services are exploding and are making it worst. As highlighted on my precedent blog post, Visiting Amazon consumes 0.0003 kWh, streaming 5 MB MP3 song takes 0.025 kWh, watching 5 minutes YouTube video takes 0.065 kWh, streaming 3 GB movie takes 14.65 kWh, and online video game takes about 78.13 kWh. Therefore be aware and use streaming service appropriately. You can also reduce the resolution of the video quality when streaming on your phone, you don’t really need High Definition Resolution on such a small screen.

In conclusion,

making it an habit to spend a few minutes to one hour monthly to reduce your cloud storage space, cleaning your emails, deleting some online activity history and social media posts, streaming reasonably will reduce your carbon footprint and our planet will feel a bit better. We live in a digital smarter world, let’s also make it greener.

Data Centers and internet are some of the worst energy consumers and polluters, True or False?

Think about it: Every time you use Facebook,  Messenger, Instagram, What’sApp, Snapchat or TikTok or every time you launch a google search, order on Amazon, pay your bills via online banking, or just receive, send or archive an email, or stream music or videos, or sit in a zoom meeting, or almost whatever you do on your computer, tablet or phone, you are using internet resources hosted in Data Centers which means you are consuming electricity and generating CO2; How much? That’s THE  Question, so here is some background information based on well known studies and reports:

Data Centers are the Brain of the Internet, they host servers, computers, storage, controllers, network devices, and cooling systems all powered by electricity power, in order to connect, receive, process, compute, share, duplicate and store data, more and more data and higher flowing every day.

Data Center

We estimate an average energy consumption in a Data Center of 3% for the network, 11% for the storage, 43 % for the servers and 43% for the cooling and power systems.

As the number of internet and IT users is growing and the flow of data is exploding, with more and more audio and video streaming, more highly consuming Big Data and Artificial Intelligence (AI), and more and more Internet-of-Things (IoT) sensors are deployed, so are data services and Data Centers growing exponentially and so is the energy consumption growing alarmingly.

Calculating the global energy consumption of these Data Centers and of the Internet is a complex problem requiring some estimations, as companies and countries are not really providing detailed reports.

Estimates varie depending on the following relevant studies and sources:

  • Koomey in 2011 estimated that data centers accounted for between 1.1 percent and 1.5 percent of global electricity used in 2010.
  • Masanet et Al in 2020 estimates that global data centers consumed around 205 terawatt-hours (TWh) in 2018, or over 1 percent of global electricity use,
  • Estimates of annual data center electricity usage vary from 200 terawatt hours (TWh) (Jones, 2018) to 500 TWh (Bashroush & Lawrence, 2020). The lower of these figures would suggest that data centers consume 1% of global electricity (Jones, 2018), but this could be significantly higher. One study suggests that global data center energy usage was 270 TWh in 2012 (Van Heddeghem et al, 2014). Another study estimates that 104 TWh will be used by European Union data centers in 2020, which makes a global total of 200 TWh unlikely (Avgerinou, Bertoldi & Castellazzi L, 2017).
  • Wildly varying estimates for the energy intensity of the internet have been published, ranging from 136 kWh/GB in 2000 to 0.004 kWh/GB in 2008, but a more recent estimate analysing calculation methodologies settled on 0.06 kWh/GB for 2015 (Aslan et al, 2018). This is decreasing by 50% every 2 years (Aslan et al, 2018).
  • Calculating the energy intensity of the internet is difficult – Aslan et al (2018) only considers fixed line networks in developed countries. Calculations are missing for mobile networks that will account over 20% of all internet traffic by 2022, growing at 46% per year (Cisco, 2019); and internal connectivity within data centers is not included but is doubling every 12-15 months (Singh et al, 2015). These excluded factors and no recent calculations examining networking equipment speeds up to current fastest 400Gb (Ethernet Alliance, 2019) devices means that it is difficult to estimate the true energy impact of networking today.

Some of these numbers may seems wrong as the percentage is decreasing despite the fact that the volume is increasing, but it just means that fortunately the significant improvement energy efficiency of the devices and data centers, as well and new technologies such as server virtualization and Cloud-Computing and Cloud-Storage have been compensating for the growth of users and data of the last decade.

Internet

The amount of computing done in data centers more than quintupled between 2010 and 2018. However, the amount of energy consumed by the world’s data centers grew only six percent during that period, thanks to improvements in energy efficiency. Servers, storage, and network hardware on its own consumed more energy in 2018 (130TWh) than it did in 2010 (92TWh). But these devices are now much more energy and a lot more computing efficient for every 1Wh used.

Still, The main issue is this hungry use of electricity generate carbon dioxide (CO2) emissions. Again we can only estimate the level produced as it depends on many factors.

In 2018 Pearce claimed that the world’s data centers emit as much CO2 as the global aviation industry (which generates 3% of global emissions) , which is roughly 900 billion kilograms of CO2 (Air Transport Action Group 2020). Considering that global data centers recently consumed around 205 billion kWh, for this claim to be true, their average electricity emissions intensity would have to be around 4.4 kg CO2/kWh. Which is probably overestimated as fortunately all Data Centers don’t run on electricity produced by coal or fuel. Lately the larger providers such as Google, Microsoft, Amazon, Apple and big Telcos are using more and more renewable energy or implementing their giant Data Centers in Nordiks countries to reduce cooling energy and cost. The new industry trend is for multi-tenant data centers to accommodate hyperscale cloud firms and fulfill growing demand from technologies such as AI and IoT.

Just a few others facts that may ring a bell:

  • In 2020 Kamiya claimed that watching Netflix for 30 minutes generates 1.6 kg of CO2 emissions, the same as driving almost four miles/6 km. Again even if this value is a bit overestimated, it gives an idea we can relate to.
  • Visiting Amazon consumes 0.0003 kWh, streaming 5 MB MP3 song takes 0.025 kWh, watching 5 minutes YouTube video takes 0.065 kWh, streaming 3 GB movie takes 14.65 kWh, and online video game takes about 78.13 kWh

In 2016 Koomey-led study of data center energy use in the US, which was paid for and published by the US Department of Energy, found that collectively, all data centers in America consumed 2 percent of all electricity consumed nationwide.

Fortunately the last 20 years have seen major efficiency improvements, but unfortunately they are predicted to come to an end and the data center energy usage is predicted to double by 2030. If electricity continues to be a major source of data center energy and is generated from non-renewable sources, data center emissions could exceed the aviation industry which is currently responsible for 2% of annual human-generated CO2 (IATA, 2020).

The Internet’s energy consumption, whatever 1 or 2% of global energy consumption is significant but still is a fraction of that of the transportation industry, (including cars, trucks, bus, trains, planes etc) which accounts for 61 percent of oil consumption, and of course the worst energy consumers and polluters industries are Chemical, Refining and Mining industries.

power generation

Therefore on a positive note as Internet uses less power and causes a smaller environmental impact than transportation, moving more tasks (like teleconferencing, telebanking and working from home) to the Internet to reduce travel and commute makes sense.

And on that note: numbers will certainly show a reduction of travel and transportation and an increase on internet use due to Covid-19 pandemic for 2020, and a consequent shift on energy consumption and CO2 emissions.

Every day Internet and technology are progressing with a devices and new services. The computing power is increasing and so is the energy consumption of these devices. Our mobiles, computers, laptops, and other gadgets rely on energy to operate all the time (About 0.0003 kWh is consumed while charging a mobile over USB for 7 minutes).

In the future the rapidly growing demand for information service and compute-intensive applications like AI and IoT (enabled by 5G, and 6G to come) will certainly outpace the efficiency gains, therefore significant investments in renewable power will be required to minimize the climate implications of data center energy use.

Objective of this blog was to raise your awareness on the energy consumption and C02 emission of the IT Industry and Internet and it’s potential impact on environment and climate change, as we are all users and consumers.

In my next blog I will share a few tips of how to reduce your personal internet usage, energy consumption and emissions.

Gartner Hype Cycle for Emerging Technologies- Hype or Reality?

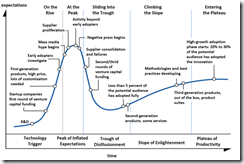
You probably know about Gartner Hype Cycles, and just in case you don’t it is communicated as an infographic produced regularly by famous IT research and advisory firm, Gartner, “to represent graphically the maturity, adoption and social application of specific technologies” (wikipedia), in a nutshell the lifecycle of innovations and products in the markets.

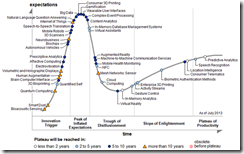
I just wanted to share with you theGartner hype-cycle-for emerging technologies 2013 latest Gartner Hype Cycle chart for Emerging Technologies (Image attached- dated August 8, 2013). It is of course a very interesting diagram, including a lot of technologies, and based on the collection of lots of data, which does not mean everything is thru and that we have to drink their coolaid, straight“on the rocks”.

What is predominant this year is the hype around smart machines, machine-to-machine (M2M), cognitive computing and the Internet of Things, all the Human/Machine relationship stuff and it’s impact on the enterprise of the future. There are so many innovations and emerging technologies and growing markets in that space, this is no surprise. (I just want to know more about SmartDust!)

Hype-Cycle-GeneralHowever, and more specifically, based on my focus at my present job,  I am looking with some level of skepticism, with all due respect to Gartner analysts, at two of these technologies: Cloud Computing and Big Data.

Gartner shows Cloud Computing as having passed the Peak of Expectation and already falling way down the Trough of Disillusionment ! I certainly don’t agree with that assessment. In my view Cloud is delivering on premises and on planned schedule, with a steady adoption and with little failure rate and not much negative press and still has with a huge potential growth.

Also Gartner shows Big Data almost at the mastering the hype cyclePeak of Inflated Expectation and again I would not embrace this idea; Big data is still in very early stage, it is transforming if not revolutioning all enterprise information management and business processes, and much more is  to come before it come to this peak.

Where I would agree, however is on the positioning of predictive Analytics, welcome to the Plateau of Productivity, my company should be able to make money out of it in the short term.


PlanetHype_1024So Hype or Reality?

I am no Nostradamus… Feel free to comment and provide your own vision, as your real life experience within your company or your customers if you’re a consultant or a technology vendor, may be as valid as Gartner’s survey and interpretation. No offense, we are talking about predictions and there is no such thing as Magic! and as my charming wife would say “Everyone is entitled to his own opinion."

The Future is Bright for Linux

Linux, the new kid on the block of operating systems has been enjoying a steady growth and adoption in the Enterprise Servers segment for the last few years and especially in the Largest Enterprises, Fortune 1,000 and Government Agencies.

ibl linux tux imagesCAOQGB17 In the early days, few years ago, around 2002/2003, as I was a Product Marketing Manager and a Linux Advocate , part of the IBM Linux Technology Center, we were advocating and preaching the benefits of Linux to our customers, our ecosystems of partners, & developers, to Press & Media, in order to accelerate Linux adoption, and we had to overcome many obstacles; our programmers were developing codes in our Linux Labs to offer to the Linux Open Source Community; Our Linux Team was building integrated infrastructure offering for ISVs and customers to build their applications on top and we were collaborating with Industries Open Standards groups to create Industry Open Frameworks. We have been just a part of a much larger movement, but we had been embracing this new wave, and our involvement has modestly but certainly been helping the early adoption of this new OS in the Enterprise segment and I am glad to have been part of it.

Only few years later, today, it’s amazing to see how Linux has been evolving, growing and is widely recognised as an Enterprise level OS.

So from whom is Linux grabbing market share?

Originally Linux was mainly used by early adopters for tests, pilots and developers, and then it quickly started to replace UNIX in the Enterprise to migrate UNIX applications or deploy new Edge applications and by more and more developers to develop new applications.

In a second phase adoption went broader to more enterprises, migrating more and more UNIX applications, and moved to more mission-critical applications.

However lately Linux is also significantly grabbing market share from Microsoft and that is indeed a new trend.

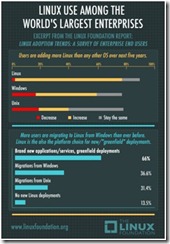
-The latest report published by Linux Foundation End User Council (a non-profit organisation) and Yeoman Technology Group reveals some very interesting facts and numbers that I would summarise for you:

  • 76.4%of Big companies are planning to add more Linux servers in the nextLinux Adoption year,
  • 41.2% are planning to add Windows servers in the next year,
  • 43.6% are planning to decrease use of Windows servers in the next year,
  • 60% are planning to use Linux for more mission critical workloads,
  • 66% are deploying new applications on Linux,
  • 36% are migrating from Windows,
  • 31.4% are migrating from Unix to Linux,
  • CIOs see Linux as more strategic, and less as a way to just cut cost,
  • Features and technical superiority came in at 67.5% as the primary driver for adopting Linux,
  • 65.4% said lower TCO is a factor but not the first driver,
  • 50% said that ability to modify code was a reason to adopt Linux,
  • 45.8% said that long-term viability of the platform is a reason to adopt Linux,
  • 33% say that they test and submit bug reports,
  • 13.4% actively contribute code to Linux,
  • 70.3% are using Linux as their primary cloud platform,
  • 86.5% of respondents feel Linux continues to improve,
  • 60% of their CIO sees Linux as more strategic to the organization as compared to three years ago.

So in conclusion we can see some clear market trends:

Linux Unix_F – Linux continue to take market share from UNIX but now also grab market share from Windows.

– Large Enterprise plans to deploy more Linux servers than Windows servers in the next year and even more in the next 5 years.

– Linux adoption by large enterprises is accelerating and moving from edge to mission-critical workloads.

– Features, technical superiority, security and quality are the major drivers of adoption and not lower cost or better TCO anymore.

– Customer satisfaction is quite high.

– Linux is dominant for new developments and deployments on Cloud infrastructures and brand new “Greenfield” environment, which is the future.

The picture is not totally Pink, there is still a few obstacles on the road, the two top concerns about Linux adoption are hardware drivers and interoperability, and in third a lack of skilled resources –which is good news for the job market.

Interesting data came from another study done by Springboard Research in partnership with Spiceworks, in India, where small and mid-size businesses are increasingly favouring the Linux operating system, showing that between April 2009 and May 2010, overall Linux server OS adoption in India increased to 8.1 percent from just 7 percent and continues to rise.

This survey also revealed that Linux adoption in the Asia/Pacific region registered at almost 26 percent higher than in the U.S. and grew even faster than the global average.

So: Is Linux the UNIX Killer AND the Windows Killer?linux-wallpaper-006

For sure Linux has not been successfully yet on the desktop side, except for the unconditional love of many software developers and computers geeks, but its success on the server side has been demonstrated.

All this combined clearly shows that Linux is on the Rise and we can predict without risk a Bright Future for Linux.

Cloud Computing: The sky is the limit, but where is the money ?

With the combination of several factors: economic crisis and signs of recovery, increasingly complex virtual and physical IT infrastructure, an aging server installed base, maturing new technologies and IT managers challenged to simplify infrastructure, deliver new services quickly and reduce capital expenses and operation cost, demand for both public and private cloud computing is growing.

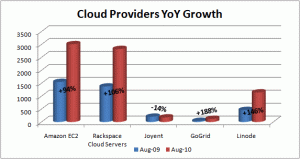
First let’s look at a few numbers:Cloud providers Growth yoy 2009-2010

  • IDC says the total global cloud market in 2010 will be $22 billion and $55 billion in 2014.
  • IDC says the total servers and storage account for $5 billion-to-$6 billion in 2010 and $15-to-$20 billion in 2015.
  • IDC also predicts server revenue for public cloud computing will grow from $582 million in 2009 to $718 million in 2014. Server revenue for the much larger private cloud market will grow from $7.3 billion to $11.8 billion in the same time period.
  • Gartner states: Cloud services are expected to hit $68.3 billion in 2010,  a 16.6% rise compared to 2009 cloud services revenue,
  • According to IBM: The global cloud computing market is expected to grow at a compounded annual rate of 28 percent from $47 billion in 2008 to $126 billion by 2012,Amazone AWS Revenue & Growth
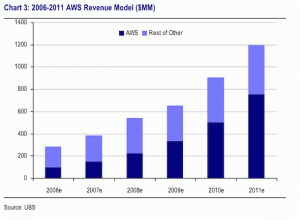
  • Amazone, a Pioneer in Cloud Computing, will generate a total revenue of $500 million this year and $1.1 billion by 2014 with its Amazon Web Services (AWS).
  • Based on UBS Investment Research firm, AWS gross revenue growth from 2006 to 2011 is estimated at 801 percent annual increase ($329.4 million).
  • UBS analysts believe that the total market for AWS-type services will be between $5-to-$6 billion in 2010 and will eventually grow to $15-to-$20 billion in 2014.
  • RightScale, another major Cloud Services Provider, announced a 1,000 percent customer spending increase from June 2009 through June 2010, a significant Cloud-based revenue growth, and a 100% increase in number of Cloud customers between the first quarters of 2009 and 2010 (43,030 to 80,080).

By the way, these revenue numbers are quite small compare to total IT market, Cloud Computing is still young but the offering is maturing and starting to shake the IT market, and even If Analysts experts do not agree on the same estimated numbers, all agree that Cloud Computing growth is sky-rocketing, and growth (and margin) is what everyone is looking for.

That is however a big and attractive pie, and there is no doubt that a lot of players are – or will be- running for a slice of it, so the question is: where is the money and who will be the winners?

First winners of the Cloud have been startups, development and test labs, Web businesses, online storage, content distribution and social media websites.

Private Cloud market opportunity appears to be huge, and today, many companies are testing or building their own private clouds on small-scale projects, however due to  the lack of maturity in enterprise-class cloud infrastructure products,some security issues, and some uncertainty on the real cost saving, Private Cloud will still be a small part of the pie on a short-term perspective.

Public Cloud has more potential and is the real Eldorado for now, and therefore many cloud solutions or services  providers are quickly moving from selling clouds to enterprises to targeting service providers for partnerships, to create an ecosystem and offer a complete service.

Web services hosted in the Cloud are definitively growing, customer demand is still growing fast, starting with Media Companies and Mobile Services as an example, as per numbers above, so Cloud Hosting and Service Providers market is certainly a real business opportunity, and today’s winners.

As Cloud Services is a natural evolution for Web hosting and virtualization, Many web hosters or outsourcers have rebranded their services as Cloud Services, offering Cloud, on-demand and pay-as-you-go hosting services, and many Virtualization vendors have rebranded their offerings as Cloud.

Software vendors are offering Software-as-a-Service (SaaS),

Infrastructure vendors are offering Infrastructure-as-a-Service (IaaS),

Applications vendors are offering Applications-as-a-Service (AaaS),

Platform vendors are offering Platform-as-a-Service (PaaS) etc…

If Enterprises are still being prudent in investing on Private Cloud, the Hybrid cloud is a balanced solution combining both public and private resources , managed through a common framework simplifying operations and reducing operation cost. Lately, Hybrid Cloud solutions offered by large vendors as IBM, HP, Microsoft etc has been slowly but steadily gathering interest, adoption and investment.

Finally, as per numbers above, there is a significant new business opportunity for servers and storage vendors, in both Private and Public Cloud market. Based on IDC report, almost 20% of servers purchased in 2009 were for cloud computing deployments.

In conclusion, the business opportunity is there, with real growth and profit, and I believe Web hosted services and Public Cloud Services Providers are today’s winners, Hybrid Cloud is on the rise, but in the future Private Enterprise Cloud may finally emerge as the holy grail.

Question for you is WHEN ?